Statistics to the rescue?
Let's get a bit nerdy now. In CS and Math, a random walk is model/algorithm which does exactly what the name implies. It’s a process where each next step taken is a completely random choice (in other words, it is made independent of previous choices/steps) but the direction of each step has a certain probability associated with it (this depends on the probability distribution being used). This process is also called Brownian Motion, a term you might be more familiar with. It's conventionallyv used for determining the probabilities of certain paths in a particular two-dimensional or three-dimensional space. If you’re interested, check out the famous Drunken Sailor random walk problem in Mathematics and Computer Science:
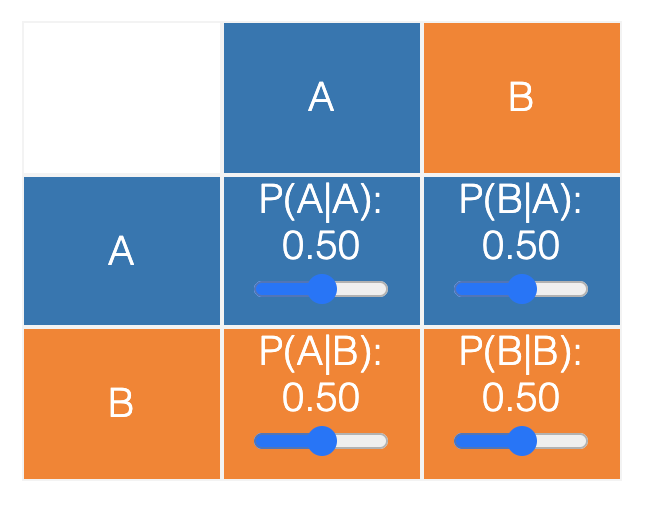
Markov Chains are essentially models that indicate how likely it is to jump from one state to the other. A simple visual of a two-state Markov Chain can be seen below:
The circles represent all possible states and the lines between them indicate the transition between particular states. From the diagram above, we can see that it is possible to get to B from A, to A from B, to remain at A from A, and to remain at B from A. In other words, there are 4 possible transitions in this two-state diagram. Representing two states is pretty simple. However, when there are too many states, the diagram can be hard to understand and actually counterproductive in many cases. Therefore, a Markov Chain can also be represented as a transition table/matrix as seen below:
A very practical example/real-world use of Markov Chains is Google’s algorithm that determines the order of the search results it shows you.
Putting these two concepts together we have a Markov Chain random walk where there is an x number of possible directions that can be taken from each point and there’s a probability associated with each direction/transition (how likely heading in that direction/to that state was).
The final bit of technicality I want to introduce is Monte Carlo (no, not the city in Monaco or the song by Remi Wolf). I’m talking about Monte Carlo methods in the context of statistics; these are just mathematical models used to estimate some task through repeated random sampling. Now, by putting Markov Chains and Monte Carlo methods together, we end up with Markov Chains Monte Carlo (or MCMC for short). This is an incredibly powerful algorithm that not only estimates outcomes through repetition but takes into account the previous state/position in the space being computed upon. It’s essentially recursive probability with awareness of context/history. Fascinating stuff.
As Moon Duchin mentions in her paper, “MCMC has been successfully used to decode prison messages, probe the properties and phase transitions of liquids, find provably accurate fast approximations for hard computational problems, and much more. A 2009 survey by the eminent statistician Persi Diaconis estimated that MCMC drives 10 to 15 percent of the statistical work in science, engineering and business, and the number has probably only gone up since then.”
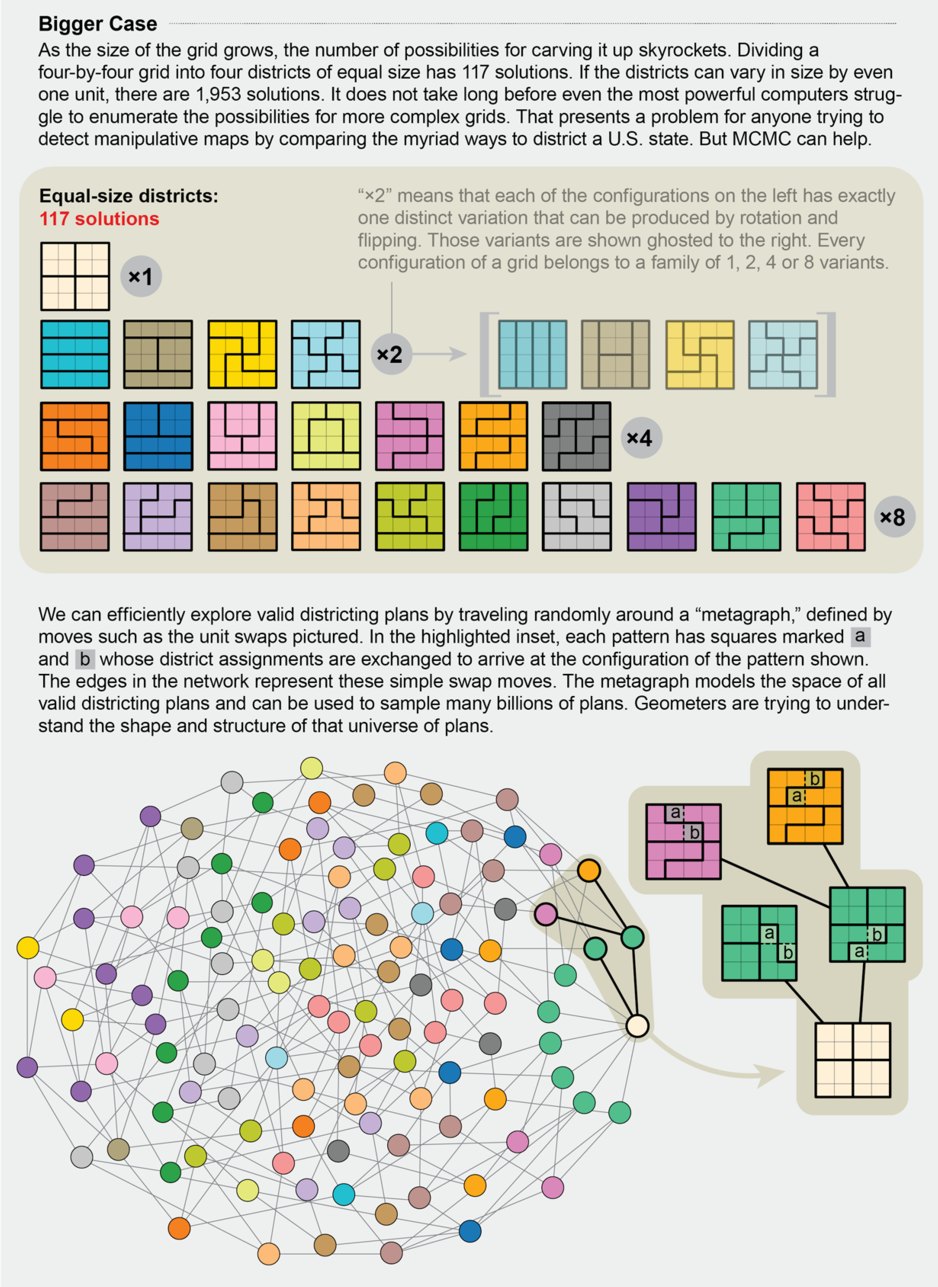
And despite the widespread application of MCMC, they’ve only been seriously used in the study of gerrymandering only from 2014 onwards. It helps in dealing with the enormous complexity of gerrymandering. MCMC essentially determines the probability of following a certain path in a certain space (in this case, the size and shape of a map). Through repetition, MCMC is able to provide a collection of such paths (in this case, possible maps) and their probabilities that are representative of ALL possible maps for that particular area. Now that there’s a sample that is representative of all maps, when individual maps are in doubt, they can be compared to the rest of the sample (by setting a baseline for what an appropriate/fair map of the area is) and it can be determined how unlikely that map is. If it’s very unlikely - i.e. a statistical outlier - then it can be classified as a gerrymandered).
Seems like a pretty cool approach I’d say. It obviously doesn’t get past the innate complexity of so many maps, but it does handle large computations well enough to be used in two recent and important redistricting cases: North Carolina and Pennsylvania. We’ll take a look at this in the next section.